What is the Home Price Index?
The Home Price Index (HPI) is a critical economic indicator that tracks changes in residential property prices across Israel. Published monthly by the Central Bureau of Statistics (CBS), this index serves as the official benchmark for measuring fluctuations in housing prices throughout the country. Formally known as “מדד מחירי דירות” in Hebrew, the HPI has been maintained since 1994, with methodological improvements implemented in 2018 to enhance its accuracy.
Unlike individual property valuations, the HPI provides a macro-level view of price trends by analyzing thousands of real estate transactions each month—typically processing between 5,000-8,000 transactions to ensure statistical significance. This systematic approach creates a reliable metric that helps homebuyers, investors, policymakers, and economists understand the dynamics of Israel’s housing market.
The index is particularly vital in Israel’s context, where housing costs represent approximately 25% of the average household’s expenditure and where homeownership holds both financial and cultural significance. As one of the most densely populated developed countries with limited land resources, Israel’s property market dynamics are closely monitored through the HPI by both domestic and international observers.
How the Home Price Index Works
Methodology
The CBS employs a sophisticated hedonic regression methodology to calculate the HPI:
- Data Collection: The index is based on actual transaction data from the Israel Tax Authority’s “מס שבח” (Real Estate Taxation) department, capturing real market activity rather than asking prices or estimates. Each transaction record includes the final sale price, location coordinates (to the neighborhood level), property characteristics, and transaction date.
- Standardization: Properties are categorized according to a detailed classification system:
- Location: Municipality, neighborhood, statistical area (over 1,200 distinct areas)
- Property Type: Apartments (by number of rooms, ranging from 1.5-6+), single-family homes, duplexes, penthouses
- Age Bracket: New construction (0-2 years), recently built (3-10 years), established (11-25 years), and older (26+ years)
- Size Categories: Eight distinct size brackets ranging from under 60m² to over 200m²
- Floor Level: Ground floor, middle floors, top floor (non-penthouse), penthouse
- Price Adjustment: The CBS employs hedonic regression analysis—a specialized statistical technique that isolates price changes from quality differences. This model:
- Accounts for over 40 different property characteristics
- Applies different weights to various features based on their market impact
- Adjusts for inflation using the Consumer Price Index (CPI)
- Incorporates seasonal adjustments to account for traditionally higher activity periods (spring and early autumn)
- Geographic Segmentation: The HPI provides hierarchical geographic analysis:
- National level (כלל ארצי)
- 9 major regions (מחוזות)
- 16 sub-regions (נפות)
- 76 natural regions (אזורים טבעיים)
- Major cities with independent reporting (Jerusalem, Tel Aviv, Haifa, Rishon LeZion, Beer Sheva, Petah Tikva, Netanya, Holon, Ashdod)
- Quality Control: Before final publication, the data undergoes multiple validation processes:
- Removal of statistical outliers (transactions ±3 standard deviations from the mean)
- Cross-verification with other property databases
- Exclusion of non-market-rate transactions (family transfers, public housing purchases)
- Minimum threshold of 30 transactions per segment to ensure statistical reliability
Interpretation
The HPI is presented as a percentage change from a baseline period (currently January 2018 = 100). The CBS publishes several versions of the index simultaneously:
Primary Index Measurements
- Nominal Index: Reflects actual market prices without inflation adjustment
- Real Index: Adjusted for general inflation using the Consumer Price Index
- Month-over-Month (MoM): Short-term percentage change from previous month
- Year-over-Year (YoY): Annual percentage change from same month in previous year
- Quarterly Moving Average: Smoothed data to reduce monthly volatility
- Seasonally Adjusted Series: Removes predictable annual patterns
These measurements allow for different interpretations:
- An increase in the nominal index indicates rising home prices in absolute terms
- A decrease reflects falling prices in absolute terms
- The real index shows whether housing is becoming more or less affordable relative to other goods
- The magnitude of change shows the intensity of price movements
- Divergence between nominal and real indices highlights the impact of broader economic inflation
For example, if the current nominal index is 135, it means housing prices have increased by 35% since January 2018 in shekel terms. However, if the real index is 122, it means housing has appreciated 22% faster than general inflation over the same period.
Reading the Monthly Reports
The CBS releases three key figures in their monthly publications:
- Headline Figure: The YoY change in the nominal index
- Latest Trend: The MoM change (seasonally adjusted)
- Real Purchasing Power Impact: The YoY change in the real index
The CBS also provides visualizations including:
- Price trend charts with 12-month moving averages
- Comparison charts between regional and national indices
- Heat maps showing regional price movements by intensity
Why the Home Price Index Matters
For Homebuyers and Sellers
- Market Timing: The HPI helps individuals determine whether current market conditions favor buyers or sellers.
- Price Negotiations: Understanding recent price trends provides leverage in negotiations.
- Investment Planning: Historical HPI data assists in forecasting potential returns on property investments.
For Policymakers
- Monetary Policy: The Bank of Israel considers housing inflation when setting interest rates.
- Housing Programs: Government initiatives to address affordability are often triggered by sustained increases in the HPI.
- Tax Policies: Changes in property taxation may be implemented in response to extreme market movements.
For Economists and Researchers
- Economic Indicator: Housing market health often correlates with broader economic conditions.
- Wealth Effects: Rising home prices can boost consumer spending through the “wealth effect.”
- Financial Stability: Rapid price increases may signal potential market bubbles, while sharp declines could indicate systemic issues.
Historical Trends in Israel’s Home Price Index
Israel’s housing market has experienced dramatic price movements over the past two decades, making it one of the world’s most dynamic real estate markets. The HPI reveals several distinct periods:
Long-Term Housing Cycles (2002-2024)
- 2002-2007: Moderate Growth Period
- Annual appreciation averaged 3-5% (inflation-adjusted)
- Growth concentrated primarily in Tel Aviv and Jerusalem
- Regional disparity relatively modest with peripheral areas seeing 1-2% annual growth
- 2008-2009: Global Financial Crisis Response
- Initial stagnation with brief price decline of 3.7% (Q4 2008)
- Rapid recovery by Q3 2009 as Israel’s banking system proved resilient
- Government stimulus and interest rate cuts to 0.5% fueled demand
- Transaction volume temporarily dropped 42% before rebounding
- 2010-2017: Unprecedented Boom Phase
- Cumulative price increase of 82.4% nationally (inflation-adjusted)
- Tel Aviv prices more than doubled (+113.7%)
- Jerusalem experienced 91.2% appreciation
- Haifa and Beer Sheva saw increases of 76.2% and 68.7% respectively
- Price-to-income ratio rose from 7.3 to 11.8 in major urban centers
- Multiple government interventions attempted (including מחיר למשתכן “Buyer’s Price” program)
- 2018-2019: Moderation Phase
- Price growth slowed to 1.2-2.8% annually (below inflation in some quarters)
- Transaction volume decreased by 14.3% from peak
- Impact of government cooling measures (higher purchase taxes for investors)
- Increased construction starts (47,430 in 2018, a 30-year high)
- Regional convergence as peripheral areas continued appreciating while central regions plateaued
- 2020-2022: Pandemic-Era Acceleration
- Initial market freeze (March-May 2020) with transactions dropping 78%
- Rapid recovery with renewed strength by Q3 2020
- Record-breaking appreciation: 17.8% in 2021 alone (highest annual increase since 1994)
- Shift in demand patterns toward larger homes and suburban locations
- Historically low mortgage rates (average of 2.14% for 25-year fixed mortgages)
- Supply chain disruptions reduced new construction completions by 23%
- 2023-2024: Interest Rate Impact Phase
- Bank of Israel rate hikes (from 0.1% to 4.75%) cooled market
- Monthly transaction volume declined 31% from 2022 peak
- Price growth moderated to 5.2% annually (Q4 2023)
- Increased price divergence between central and peripheral regions
- First-time buyer segment particularly affected by reduced affordability
- New construction starts declined to 41,280 (2023), exacerbating future supply concerns
Price Multiple Analysis
The housing boom has fundamentally changed affordability metrics:
- Average housing unit in 1996: 67 average monthly salaries
- Average housing unit in 2010: 103 average monthly salaries
- Average housing unit in 2024: 158 average monthly salaries
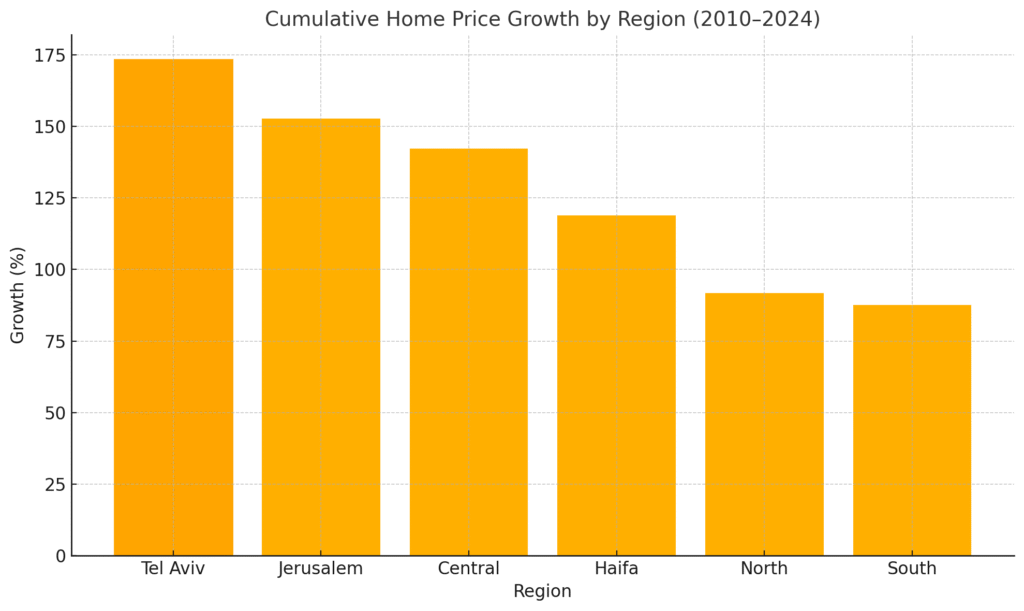
Regional Comparison (Cumulative Growth 2010-2024)
- Tel Aviv: +173.4%
- Jerusalem: +152.7%
- Haifa: +118.9%
- Central District: +142.3%
- Northern District: +91.7%
- Southern District: +87.5%
Regional Variations
The national HPI masks profound regional differences that reflect Israel’s complex socioeconomic landscape. The CBS’s regional analysis reveals distinct housing markets operating within the country:
Distinct Regional Markets
Tel Aviv and Central Gush Dan
- Functions as its own micro-market with global rather than national influences
- Price premium ranges from 78-122% above national average
- Apartment sizes typically 18-25% smaller than national average
- Highest investor concentration (31% of purchases)
- First-time buyers represent only 22% of transactions (vs. 38% nationally)
- Significantly higher proportion of luxury developments (23% of new construction)
- Key neighborhoods show extreme variance:
- Neve Tzedek: ₪78,250/m²
- North Tel Aviv: ₪68,420/m²
- Jaffa: ₪46,780/m²
- South Tel Aviv: ₪38,350/m²
Jerusalem
- Experiences unique market dynamics due to religious and political significance
- Sharp neighborhood divisions with up to 300% price differentials
- Western neighborhoods (German Colony, Rehavia): ₪51,680-58,920/m²
- Northern neighborhoods (Ramot, Pisgat Ze’ev): ₪27,780-32,450/m²
- Eastern neighborhoods: ₪17,890-22,340/m²
- Ultra-Orthodox areas experience distinct cycles driven by community growth
- Foreign buyer impact significant (18% of purchases, primarily from USA and France)
- Lower mortgage utilization (62% vs. 73% national average)
- Highest proportion of cash purchases (27%)
Haifa and Northern Coast
- Bifurcated market between Carmel neighborhoods and lower city
- Highest price/rent yield ratio in major cities (4.2% vs. 3.1% in Tel Aviv)
- Closest correlation to national average price movements (0.87 correlation coefficient)
- University influence creates distinct rental market
- Industrial zone proximity impacts neighborhood valuations
- Emerging tech sector creating new demand patterns
- Transportation infrastructure improvements (Carmel Tunnels, Metronit) significantly impacted neighborhood values
Southern Region
- Generally 31-60% below national average
- Highest affordability index for local incomes
- Most responsive to interest rate changes
- Strongest correlation with new construction impact (15% price reduction when new supply exceeds 3% of existing stock)
- Military base relocations created significant localized booms
- Beer Sheva showing emerging “university city” patterns with distinct student housing market
- Highest percentage of first-time buyers (43% of transactions)
Development Towns
- Often lag behind national trends by 6-18 months
- Experience more volatile boom-bust cycles
- Show highest sensitivity to:
- Public transportation improvements (+8-14% premium when connected to rail network)
- New employment centers (+11-17% when major employer relocates)
- Government incentive programs (מחיר למשתכן created 12-18% artificial price suppression)
- Netivot, Sderot, and Ofakim experienced highest percentage growth (2018-2023) following infrastructure investments
- Significant disparity between new construction and existing home values (28-35% premium for new builds vs. 12-18% nationally)
Neighborhood-Level Insights
The CBS’s granular data reveals even more pronounced variations within cities:
- Same-city neighborhoods can vary by up to 320% in price per square meter
- Jerusalem shows the highest intra-city variation
- Distance to public transportation creates up to 24% premium in peripheral cities vs. 7-9% in central regions
- School district boundaries create distinct “border effects” with up to 15% price differentials on opposite sides of the same street
- Sea view premium ranges from 18% (Haifa) to 37% (Tel Aviv) to 42% (Herzliya Pituach)
Using the Home Price Index in Real Estate Decisions
For Potential Homebuyers
- Compare Regional Trends: Look beyond the national index to understand dynamics in your target area.
- Calculate the “spread differential” between national and local indices (e.g., if national HPI increased 5% but your target neighborhood increased 8%, the spread is +3%)
- Track this spread over 24-36 months to identify convergence or divergence patterns
- Neighborhoods with consistently positive spreads typically indicate structural advantages (schools, transportation, amenities)
- Areas with recent negative-to-positive spread reversals often signal emerging gentrification
- Assess Value Propositions: Use the HPI to determine if properties are priced in line with broader market movements.
- Calculate price-per-square-meter and compare to neighborhood average from CBS data
- Develop a “fair value band” of ±7% from the neighborhood median (typical transaction variance)
- Properties priced >10% below neighborhood HPI average warrant deeper investigation for hidden issues
- Properties priced >15% above neighborhood HPI average should demonstrate clear premium features
- Time Your Purchase: While timing the market perfectly is impossible, the HPI can help identify periods of relative stability.
- Monitor month-over-month changes for three consecutive flat or declining months (potential plateau)
- Watch for divergence between asking prices and transaction prices (widening indicates seller/buyer expectation mismatch)
- Calculate “months of inventory” by dividing active listings by monthly sales in your target area
- 4-6 months of inventory typically indicates balanced market conditions
- 7+ months suggests buyer’s market advantage
- 0-3 months indicates seller’s market (competitive bidding likely)
- Mortgage Strategy Optimization:
- Compare the HPI’s real (inflation-adjusted) growth rate against current mortgage interest rates
- When real HPI growth exceeds mortgage rates, higher leverage may be advantageous
- When mortgage rates exceed real HPI growth, larger down payments become more valuable
- Use the HPI’s cyclical patterns to estimate optimal mortgage term (longer fixed terms during low-rate, high-appreciation phases)
- Calculate your “housing affordability index” using: (Average Income ÷ [Monthly Mortgage Payment × 100])
- Values below 100 indicate potential overextension
- Negotiate Using HPI Data:
- Reference neighborhood-specific HPI trends during price negotiations
- Use transaction volume data to gauge seller urgency (low volume periods may increase negotiation leverage)
- Calculate days-on-market averages for similar properties and adjust offers accordingly
- Request price adjustments for properties that have been listed through periods of declining HPI
For Investors
- Identify Growth Areas: Regions with consistently above-average HPI growth may offer better long-term returns.
- Calculate “relative strength index” by dividing local HPI by national HPI and tracking the ratio
- Areas with rising relative strength ratios over 8+ quarters show structural growth potential
- Map infrastructure development projects against HPI changes in surrounding neighborhoods
- Identify neighborhoods with “HPI acceleration” (increasing growth rate) rather than just high absolute growth
- Calculate “spread momentum” (change in the local-national HPI differential) to identify emerging hotspots
- Diversification Strategy: The varying performance across regions makes geographic diversification effective in Israel.
- Analyze HPI correlation coefficients between different regions
- Low or negative correlations (below 0.5) indicate good diversification potential
- Create a “correlation matrix” for major submarkets to optimize a property portfolio
- Balance high-appreciation areas (typically lower yield) with high-yield areas (typically lower appreciation)
- Calculate total return projection using: (Annual Rent ÷ Purchase Price) + (Annual HPI Change) – (Annual Expenses)
- Risk Assessment: Rapid price increases might signal higher risk of market corrections.
- Calculate the “boom indicator” by comparing 12-month HPI change to 10-year average
- Readings 50%+ above long-term average signal heightened correction risk
- Monitor the price-to-rent ratio for warning signs (typical range: 19-26 nationally)
- Values above 30 indicate potential overvaluation
- Track “institutional investment percentage” in transaction data (>25% institutional buyers often precedes market peaks)
- Calculate “rental yield compression” by tracking yield changes over time
- Declining yields without corresponding interest rate decreases may signal overvaluation
- Value-Add Opportunity Identification:
- Analyze HPI differentials between renovated and unrenovated properties in the same neighborhood
- Calculate “renovation premium” for different improvement types using HPI microdata
- Identify neighborhoods with growing “renovation gap” (increasing spread between renovated/unrenovated prices)
- Target areas with low current HPI but positive catalysts (new transportation, rezoning, commercial development)
- Map “gentrification waves” using sequential HPI increases in adjacent neighborhoods
- Exit Timing Optimization:
- Create a “market cycle position indicator” using:
- Transaction volume trends (declining volume often precedes price corrections)
- Months of inventory (rising inventory signals potential oversupply)
- Spread between asking and transaction prices (widening spread indicates buyer resistance)
- Mortgage approval rates (declining approvals suggest affordability challenges)
- Calculate “momentum exhaustion” by tracking deceleration in quarterly HPI growth rates
- Monitor policy changes that historically impact the HPI (interest rates, purchase taxes, investor regulations)
- Identify historical patterns of cyclical peaks and troughs in your specific submarkets
- Create a “market cycle position indicator” using:
Challenges and Limitations
While valuable, the HPI has several limitations to consider:
- Reporting Delay: There’s typically a 1-2 month lag between market activity and index publication.
- Doesn’t Capture Everything: The index doesn’t reflect financing costs, purchasing power, or quality-of-life factors.
- Aggregation Effects: Even regional indexes aggregate diverse neighborhoods, potentially masking micro-market trends.
- New Construction: The index primarily tracks existing home sales, potentially underrepresenting the impact of new developments.
Conclusion
The Home Price Index serves as a crucial tool for understanding Israel’s dynamic real estate market. By offering a standardized measure of price changes across different regions, the HPI provides valuable context for individuals and institutions navigating the housing sector.
Whether you’re a first-time homebuyer, a seasoned investor, or a policy analyst, incorporating HPI data into your decision-making process can lead to more informed choices in one of Israel’s most significant economic sectors.
Practical Applications: Case Studies
Case Study 1: First-Time Homebuyer in Modiin
Sarah and David, a young couple with a combined monthly income of ₪25,000, were looking to purchase their first apartment in Modiin in 2023. Here’s how they applied HPI analysis to their decision-making:
- Historical Analysis: They examined Modiin’s HPI data and discovered:
- 5-year appreciation of 42.3% (vs. national average of 51.7%)
- Consistent 3-5% annual growth without significant volatility
- Price differential of -21.4% compared to nearby Tel Aviv suburbs
- Neighborhood Comparison: Using CBS neighborhood-level data, they identified:
- Newer northern neighborhoods: ₪22,780/m² average
- Established central neighborhoods: ₪19,350/m² average
- Southern neighborhoods: ₪17,890/m² average
- Timing Decision: By tracking monthly HPI updates, they identified:
- Three consecutive months of <1% price growth following interest rate increases
- Increasing inventory levels (4.2 months of supply vs. 2.8 months six months earlier)
- Widening seller-buyer price expectation gap (8.7% average price negotiation vs. historical 4.2%)
- Final Decision: They purchased a 95m² apartment in a central neighborhood for ₪1,780,000 (₪18,740/m²), slightly below the neighborhood average, with a 35% down payment and a 25-year fixed mortgage at 3.85%.
Outcome: By timing their purchase during a temporary slowdown and using HPI data to identify a fair-value property in a historically stable neighborhood, Sarah and David secured a property that appreciated 4.2% in the following year while the broader market increased by only 2.8%.
Case Study 2: Real Estate Investor Portfolio Optimization
Michael, an experienced real estate investor with multiple properties, used HPI analysis to optimize his portfolio in 2022-2023:
- Portfolio Assessment: Michael analyzed his existing properties against HPI data: Property LocationPurchase YearOriginal PriceCurrent ValueAnnualized ReturnRental YieldTel Aviv2015₪2,150,000₪3,820,0008.57%2.3%Haifa2017₪1,120,000₪1,680,0006.98%3.7%Ashkelon2019₪980,000₪1,390,0009.12%4.2%Beer Sheva2020₪840,000₪1,070,0008.41%4.8%
- Correlation Analysis: Michael calculated the correlation coefficients between his markets:
- Tel Aviv-Haifa: 0.62 (moderate positive correlation)
- Tel Aviv-Ashkelon: 0.43 (lower correlation)
- Tel Aviv-Beer Sheva: 0.28 (low correlation)
- Haifa-Ashkelon: 0.57 (moderate correlation)
- Haifa-Beer Sheva: 0.71 (high correlation)
- Ashkelon-Beer Sheva: 0.83 (very high correlation)
- Optimization Strategy:
- Identified the Haifa-Beer Sheva high correlation as redundant exposure
- Recognized southern markets (Ashkelon/Beer Sheva) as increasingly correlated
- Noted Tel Aviv’s declining yield but strong appreciation
- Portfolio Adjustments:
- Sold the Beer Sheva property (redundant exposure with high correlation to Ashkelon)
- Reinvested in Karmiel (northern periphery) with 5.3% yield and low correlation (0.31) to other holdings
- Added partial investment in Netanya (capturing both coastal premium and developing high-tech corridor)
Outcome: Michael’s rebalanced portfolio achieved 7.2% total return (appreciation + yield) with 38% lower volatility during the 2023 interest rate increases, significantly outperforming both the national HPI and his previous portfolio structure.
Additional Resources
Official Data Sources
- Central Bureau of Statistics – Housing Price Index – Official source for the Home Price Index, including interactive dashboards and raw data downloads
- Bank of Israel Housing Market Reports – Quarterly analysis of housing market trends, mortgage markets, and financial stability implications
- Israel Tax Authority Property Transaction Database – Searchable database of actual transaction prices by neighborhood (Hebrew only)
- Israel Land Authority New Construction Data – Information on land tenders, new building starts, and government housing initiatives
Research and Analysis Tools
- Madlan Property Analytics Platform – Neighborhood-level HPI data with visualization tools (Hebrew)
- Yad2 Market Trends Tool – Current asking prices and inventory metrics (Hebrew)
- Israel Housing Market Calculator – Personalized affordability metrics based on HPI data
- Municipality GIS Property Systems – City-specific property data integrating HPI metrics (available for major municipalities)
Professional Resources
- Israel Real Estate Appraisers Association – Professional standards and methodologies for property valuation
- Israel Mortgage Consultants Association – Resources for understanding mortgage markets in relation to property values
- Real Estate Research Institute – Academic research on housing economics in Israel
Last Updated: April 2025